Revenue Analytics - Understand Your Grooming Business Numbers
Monthly and yearly revenue, outstanding invoices, VAT summary, and top services: a revenue dashboard built specifically for pet grooming salons.
Most groomers can feel whether a month was a good month. Very few could tell you, without guessing, whether it was better or worse than last September, or which service carried the week. That's not a knowledge gap; it's just that revenue data usually lives in invoices, the bank, the tax return, and a slightly hopeful memory, and those don't add up to a dashboard.
Proper revenue analytics isn't about spreadsheets and charts for their own sake. It's about stopping the guessing. When you can see your numbers on one screen, decisions that used to feel uncertain (pricing, hiring, hours, services to drop) become obvious.
What are revenue analytics in GroomSome?
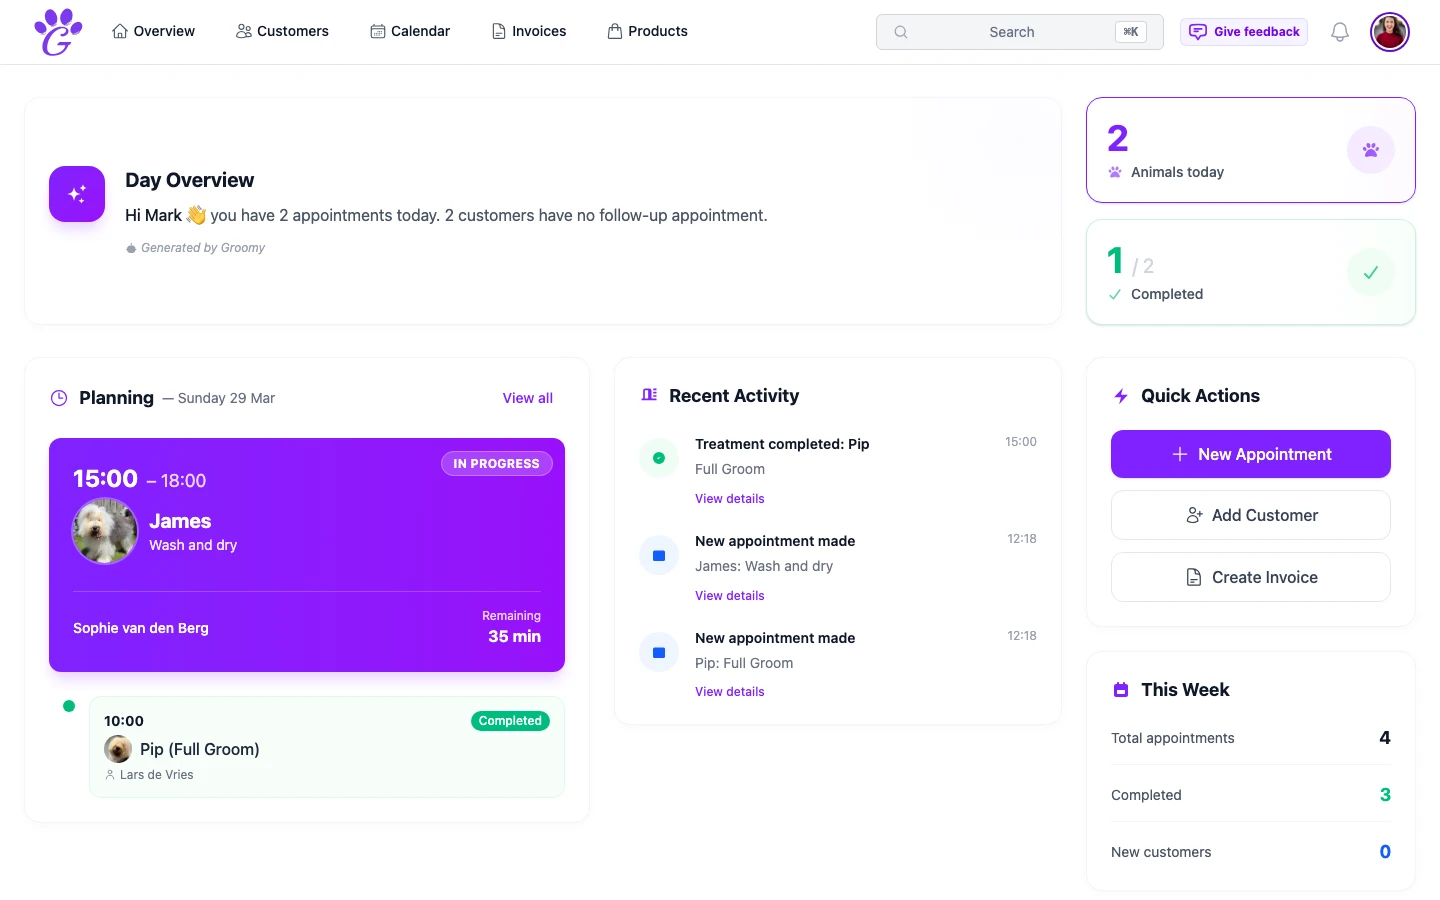
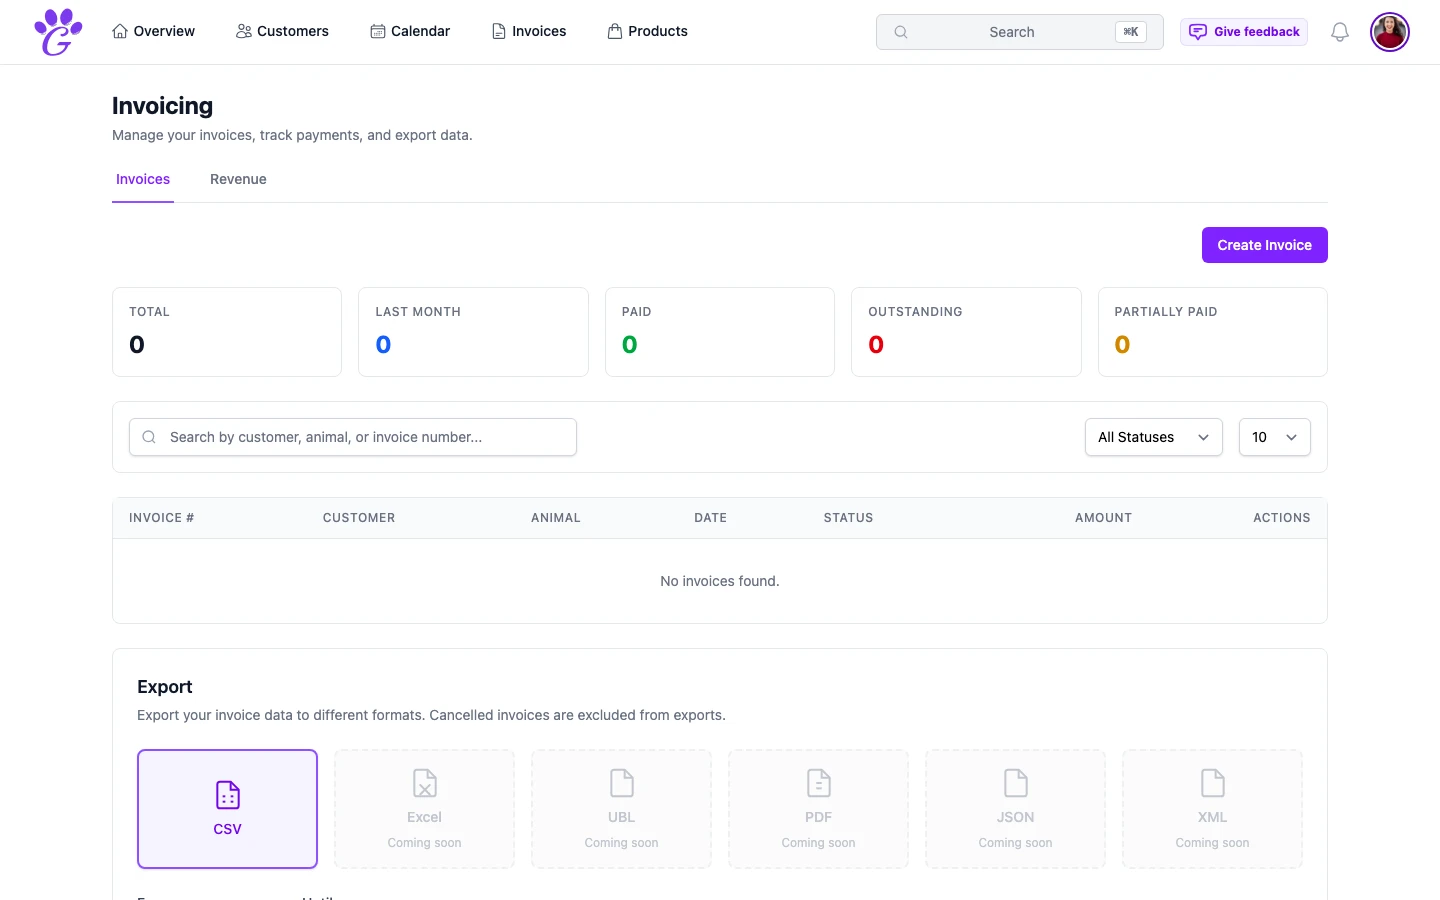
Revenue analytics is the dashboard and reporting layer that sits on top of your invoices. Paid and outstanding amounts, monthly and quarterly views, VAT summary, aging analysis for overdue payments, and revenue per service: all generated automatically from the invoices you're already creating.
You don't do anything extra to generate these numbers. Every invoice you issue feeds the dashboard. The only work required on your side is actually marking invoices as paid when payments come in, which takes seconds.
Why revenue analytics matter for groomers
"I was busy" and "I made money" are different statements. Some of the busiest weeks in grooming are actually the least profitable: too many discounted regulars, too many long de-mattings, too many quick baths that barely cover the shampoo. Analytics surface that.
- Know whether the month was actually good. Paid revenue versus last month, last quarter, last year. Feeling is replaced by a number.
- See what earns vs what takes time. Top services by revenue versus by count. If the 30-minute bath appears at the top of "count" but nowhere near the top of "revenue", that's a signal.
- Spot slipping clients. Outstanding balance isn't about chasing; it's about noticing who forgot to pay, before the invoice ages into awkwardness.
- Plan for VAT. Tax quarters don't sneak up when a running VAT summary is on screen at all times.
- Make pricing decisions with evidence. A year of data turns the next price review from a gut call into a five-minute exercise.
- Decide when to hire. If revenue is consistently above a threshold you set, that's a hire signal. If it's flat despite a full calendar, that's a pricing signal.
Key capabilities
- Revenue charts: paid revenue and total revenue side by side, so you can see both what you've earned and what's still in transit.
- Monthly, quarterly, yearly views: zoom out for planning, zoom in for this week.
- Stats cards: total revenue, paid, outstanding, always visible on the dashboard.
- VAT summary: total VAT collected, broken down by rate; useful at quarter-end.
- Aging analysis: which invoices are 30, 60, 90 days overdue, so nothing ages quietly into lost revenue.
- Top services by revenue: see which services actually pay the bills, and which ones only feel busy.
- Revenue per customer: identify the small handful of clients who drive most of the income.
- Per-period comparisons: this month vs last month, this quarter vs last year.
How to get started
Revenue analytics is enabled automatically; you don't need to turn anything on. But it becomes useful in proportion to the data you feed it.
- Issue digital invoices for everything, even cash transactions. Every line of data helps the dashboard.
- Mark invoices paid on the day they're paid. Not at the end of the week, not at the end of the month. Same day.
- Use consistent service names. "Bath" and "Bath & tidy" should be the same service if they're the same job; otherwise analytics splits the same job across two rows.
- Check the dashboard weekly. Monday morning is a good habit. Five minutes a week.
After a quarter of consistent use, you have trustworthy numbers. After a year, you have the basis for every pricing, hiring, and service decision you'll make.
Revenue analytics doesn't give you more time in the day, and it doesn't find you new clients. What it does is take the decisions that groomers usually make by instinct and make them visible. A year in, you'll know exactly where the money is coming from, and, just as importantly, where it isn't.